 |
Datalogger in wheat crop - Bordertown, October 5. source: M Zerk |
The following graphs show changes in soil moisture status for the past month in two wheat crops. Graphs 1 and 3 display soil moisture content (i.e. how much water is in the soil, expressed in %), whereas Graphs 2 and 4 display soil moisture tension (i.e. how much effort must be applied to extract the water, expressed in -kPa). Content is recorded using SM200 sensors connected to MEA t-Bug loggers and tension is recorded using Watermark sensors connected to MEA g-Bug loggers. At both sites, sensors were installed within a week of sowing at positions 10, 20, 30 and 40 cm below the surface.
 |
Graph 1 (soil water content, %) - Bordertown wheat. Early signs of flowering near the monitored site. Crop water use at 10 cm (red) has slowed further and the trace is now quite flat. Moisture content at the remaining depths is little changed, apart from the small increase at 20 cm (blue trace) that may be a result of capillary rise. |
 |
Graph 2 (soil water tension, -kPa) - Bordertown wheat. The 10 cm (red) trace is at approximately -80 kPa - the saw-tooth pattern perhaps a result of daily water use being partially replenished by capillary movement in the evening. Soil water tension at all other depths suggests that, at this stage, the crop has ready access to water. |
 |
Graph 3 (soil water content, %) - Wolseley wheat. The rate of water use has declined at 10 (red), 20 (blue) and 30 (green) cm, but increased at 40 cm (purple). It will be interesting to see if the crop can draw to below 30 % moisture at 20 and 30 cm if no rain is received in the coming weeks. |
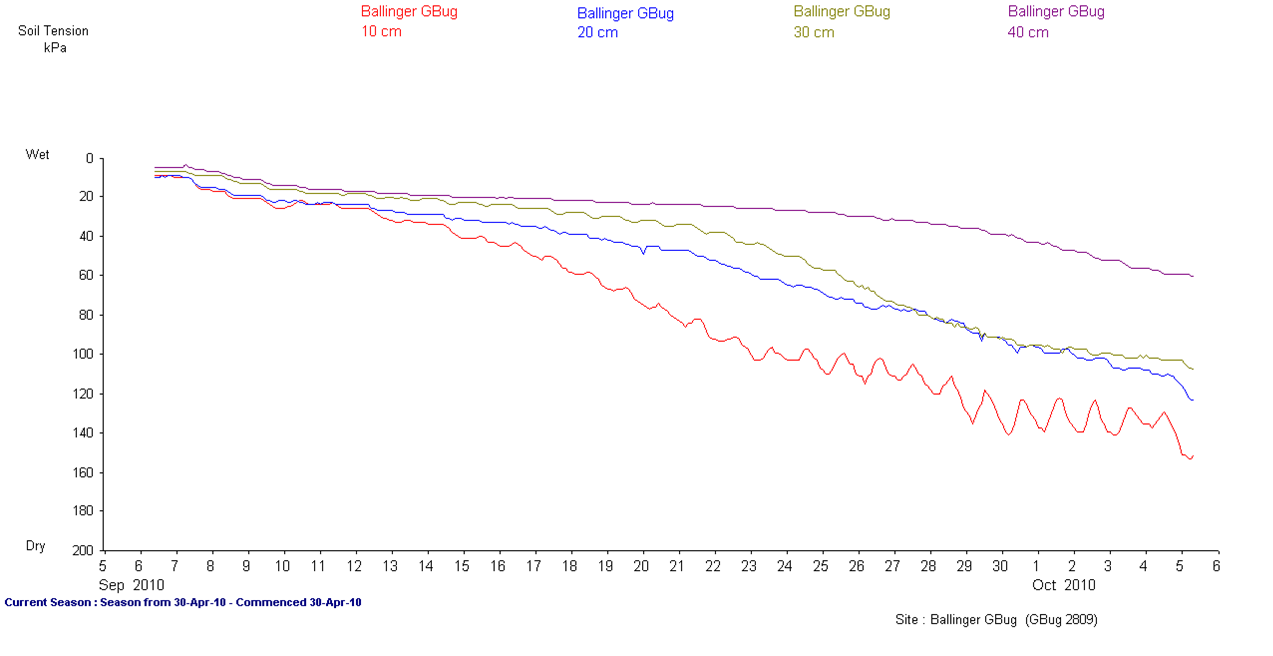 |
Graph 4 (soil water tension, -kPa) - Wolseley wheat. Soil water tension at the first three depths have passed the nominal -80 kPa threshold, with the 40 cm (purple) trace approaching -60 kPa. The decline in crop water use observed in Graph 3 is clearly explained by the degree of tension observed here. |
To give some perspective of current moisture levels, the following graph displays 3-months of data from the site at Bordertown.
 |
Graph 5 (soil water content, %) - Bordertown wheat. |
Return to this site in the next fortnight to view the most recent data. Both sites are near to flowering - a period of high water demand - so we are expecting to see dramatic changes in the graphs.
Meanwhile, please post your comments and questions or give me a call:
Michael Zerk
Irrigation Consultant
Rural Solutions SA
Office: (08) 8762 9176
Mobile: 0428 101 539
No comments:
Post a Comment